Articles by "Data Analysis"

Showing posts with label Data Analysis. Show all posts

Brij B. Gupta, Mamta ... 369 pages - Language: ‎English - Publisher: ‎World Scientific Publishing Company; (December, 2023).


With the proliferation of information, big data management and analysis have become an indispensable part of any system to handle such amounts of data. The amount of data generated by the multitude of interconnected devices increases exponentially, making the storage and processing of these data a real challenge.

Big data management and analytics have gained momentum in almost every industry, ranging from finance or healthcare. Big data can reveal key insights if handled and analyzed properly; it has great application potential to improve the working of any industry. This book covers the spectrum aspects of big data; from the preliminary level to specific case studies. It will help readers gain knowledge of the big data landscape.

Highlights of the topics covered include description of the Big Data ecosystem; real-world instances of big data issues; how the Vs of Big Data (volume, velocity, variety, veracity, valence, and value) affect data collection, monitoring, storage, analysis, and reporting; structural process to get value out of Big Data and recognize the differences between a standard database management system and a big data management system.

Readers will gain insights into choice of data models, data extraction, data integration to solve large data problems, data modelling using machine learning techniques, Spark's scalable machine learning techniques, modeling a big data problem into a graph database and performing scalable analytical operations over the graph and different tools and techniques for processing big data and its applications including in healthcare and finance.

Jeffrey Paul Wheeler ... 474 pages - Language: English - Publisher: ‎Chapman and Hall/CRC; (December, 2023).


The primary goal of this text is a practical one. Equipping students with enough knowledge and creating an independent research platform, the author strives to prepare students for professional careers. Providing students with a marketable skill set requires topics from many areas of optimization. The initial goal of this text is to develop a marketable skill set for mathematics majors as well as for students of engineering, computer science, economics, statistics, and business. Optimization reaches into many different fields.

This text provides a balance where one is needed. Mathematics optimization books are often too heavy on theory without enough applications; texts aimed at business students are often strong on applications, but weak on math. The book represents an attempt at overcoming this imbalance for all students taking such a course.

The book contains many practical applications but also explains the mathematics behind the techniques, including stating definitions and proving theorems. Optimization techniques are at the heart of the first spam filters, are used in self-driving cars, play a great role in machine learning, and can be used in such places as determining a batting order in a Major League Baseball game. Additionally, optimization has seemingly limitless other applications in business and industry. In short, knowledge of this subject offers an individual both a very marketable skill set for a wealth of jobs as well as useful tools for research in many academic disciplines.

Many of the problems rely on using a computer. Microsoft’s Excel is most often used, as this is common in business, but Python and other languages are considered. The consideration of other programming languages permits experienced mathematics and engineering students to use MATLAB® or Mathematica, and the computer science students to write their own programs in Java or Python.

Tanvir Mustafy, T. Ur Rahman ... 281 pages - Language: ‎English - Publisher: ‎Springer; (January, 2024).


This textbook summarizes the different statistical, scientific, and financial data analysis methods for users ranging from a high school level to a professional level. It aims to combine the data analysis methods using three different programs—Microsoft Excel, SPSS, and MATLAB. The book combining the different data analysis tools is a unique approach. The book presents a variety of real-life problems in data analysis and machine learning, delivering the best solution. Analysis methods presented in this book include but are not limited to, performing various algebraic and trigonometric operations, regression modeling, and correlation, as well as plotting graphs and charts to represent the results. Fundamental concepts of applied statistics are also explained here, with illustrative examples. Thus, this book presents a pioneering solution to help a wide range of students, researchers, and professionals learn data processing, interpret different findings derived from the analyses,and apply them to their research or professional fields.

The book also includes worked examples of practical problems. The primary focus behind designing these examples is understanding the concepts of data analysis and how it can solve problems. The chapters include practice exercises to assist users in enhancing their skills to execute statistical analysis calculations using software instead of relying on tables for probabilities and percentiles in the present world.

Dothang Truong ... 577 pages - Language: ‎English - Publisher: Chapman and Hall/CRC; (February, 2024) - ISBN-10:‎ 0367755386 - ISBN-13:‎ 978-0367755386.

As data continues to grow exponentially, knowledge of data science and machine learning has become more crucial than ever. Machine learning has grown exponentially; however, the abundance of resources can be overwhelming, making it challenging for new learners. This book aims to address this disparity and cater to learners from various non-technical fields, enabling them to utilize machine learning effectively.

Adopting a hands-on approach, readers are guided through practical implementations using real datasets and SAS Enterprise Miner, a user-friendly data mining software that requires no programming. Throughout the chapters, two large datasets are used consistently, allowing readers to practice all stages of the data mining process within a cohesive project framework. This book also provides specific guidelines and examples on presenting data mining results and reports, enhancing effective communication with stakeholders.

Designed as a guiding companion for both beginners and experienced practitioners, this book targets a wide audience, including students, lecturers, researchers, and industry professionals from various backgrounds.

Felix Zumstein ... 335 pages - Language: ‎English - Publisher: ‎O'Reilly Media; (April, 2021) - ISBN-10: 1492081000 - ISBN-13: 978-1492081005.


While Excel remains ubiquitous in the business world, recent Microsoft feedback forums are full of requests to include Python as an Excel scripting language. In fact, it's the top feature requested. What makes this combination so compelling? In this hands-on guide, Felix Zumstein--creator of xlwings, a popular open source package for automating Excel with Python--shows experienced Excel users how to integrate these two worlds efficiently.

Excel has added quite a few new capabilities over the past couple of years, but its automation language, VBA, stopped evolving a long time ago. Many Excel power users have already adopted Python for daily automation tasks. This guide gets you started

Use Python without extensive programming knowledge + Get started with modern tools, including Jupyter notebooks and Visual Studio code + Use pandas to acquire, clean, and analyze data and replace typical Excel calculations + Automate tedious tasks like consolidation of Excel workbooks and production of Excel reports + Use xlwings to build interactive Excel tools that use Python as a calculation engine + Connect Excel to databases and CSV files and fetch data from the internet using Python code + Use Python as a single tool to replace VBA, Power Query, and Power Pivot.

William Navidi ... 960 pages - Language: English - Publisher: McGraw Hill; 6th edition (January, 2023) - ISBN-10: ‎1265875855 - ISBN-13: ‎978-1265875855.


Statistics for Engineers and Scientists stands out for its clear presentation of applied statistics. The book takes a practical approach to methods of statistical modeling and data analysis that are most often used in scientific work. This edition features a unique approach highlighted by an engaging writing style that explains difficult concepts clearly, along with the use of contemporary real world data sets, to help motivate students and show direct connections to industry and research. While focusing on practical applications of statistics, the text makes extensive use of examples to motivate fundamental concepts and to develop intuition.

MATLAB R2024a v24.1.0.2537033 x64 [Size: 12.375 GB] ... The company MathWorks is the most complete software computing computer production in … program main the company that, in fact, come, it is software MATLAB (stands for Matrix Laboratory and able laboratories, matrix), which is one of the most advanced software numerical calculations, and mathematical and a programming language, advanced, and fourth-generation and it is possible to visualize and draw the functions and data it provides. Icon and sign MATLAB that with the manufacturer’s logo is also identical from the wave equation, etc. of the membrane in L-shape and the Special Functions is extracted. Competitors of MATLAB can be used to Mathematica, etc. Maple and Mathcad noted.

Facilities and features of the software MathWorks MATLAB: – Perform a variety of calculations, heavy and complicated math – Development environment for managing code, files and data – Discover the methods to faster reach a solution – A variety of mathematical functions for linear algebra, etc. statistics. analysis, February,, optimization, etc. filtering, etc. old style numeric and… – Draw functions of the graphics were two-dimensional and three-dimensional visualization information – Design and build user interfaces under the programming languages C++, C or Java – Ability to test and measure the exact functions and charts – Possibility of signal processing, communications, image and video – Is there a box of tools from various companies, engineering, navigation, applications monitoring, such as telecommunications, control, fuzzy, etc. estimate the … statistics. gathering data, simulation system, neural network, etc. probability and… – Ability to biological computing ...

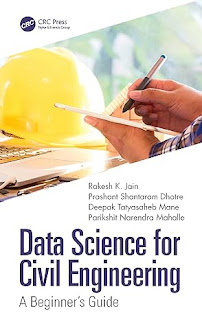
Rakesh K. Jain, Prashant Shantaram Dhotre, Deepak Tatyasaheb Mane, Parikshit Narendra Mahalle - 251 pages - Language: ‎English - Publisher: ‎CRC Press; (May, 2023).


This book explains use of data science-based techniques for modeling and providing optimal solutions to complex problems in civil engineering. It discusses civil engineering problems like air, water and land pollution, climate crisis, transportation infrastructures, traffic and travel modes, mobility services, and so forth. Divided into two sections, the first one deals with the basics of data science and essential mathematics while the second section covers pertinent applications in structural and environmental engineering, construction management, and transportation.

Features: Details information on essential mathematics required to implement civil engineering applications using data science techniques. + Discusses broad background of data science and its fundamentals. + Focusses on structural engineering, transportation systems, water resource management, geomatics, and environmental engineering. + Includes python programming libraries to solve complex problems. + Addresses various real-world applications of data science based civil engineering use cases.

This book aims at senior undergraduate students in Civil Engineering and Applied Data Science.

Language: English - Level: Beginner - Number of Lessons: 78 - Duration: 5 hours and 26 minutes.


Statistics for Business Analytics: Data Analysis with Excel is a training course on the importance of statistics in business and business data analysis in Excel software, published by Udemy Academy. Statistical modeling is a very important skill for data analysts, and in this training course you will practice this skill with Excel software. Today, data has included all parts of our lives, and the success of business and various decisions in various industries depends on access to appropriate data and their correct analysis. The world is moving day by day towards a purely data-centric direction, and in this direction, many job positions have been created for data engineers and analysts.

This course is completely comprehensive and includes all the details of statistical modeling and business analysis. What you will learn?: Data Analysis with Excel:Basic principles and basics of statistics and their application in the world of business and various industries + Carrying out data analysis and analysis projects in the powerful Excel software environment + Various statistical methods and their exploitation to solve business problems and finalize data-driven decisions + Statistical assumption test with Excel software + Data-driven decision making and its principles + Business data analysis with descriptive statistics and statistical inference in Excel software + Construction and interpretation of various statistical models based on business data + Implementation of statistical analysis or regression analysis in Excel software to predict the future + Different techniques for analyzing huge and large data sets + Evaluation of different scenarios using available data ...

Language: English - Education Time: 7 hours and 28 minutes - Level: Elementary, Secondary - Size: 2.72 GB.


Data analysis is one of the leading jobs in the current technology market. As per the forecasts of Glassdoor and World Economic Forum, the demand for data scientists will also increase in the next few years. We are generating huge data every day from different domains like Social Media, Healthcare, Sensor data… we have a great tool to analyze them and the tool is R. R programming is a powerful language used widely for data analysis and statistical computing. It is completely free and has rich repositories for packages.

In this course first, you will learn how to install R and start programming on it. It will also help you to know the programming structures and functions. This R programming in Data Science and Data Analytics covers all the steps of Exploratory data analysis, Data pre-processing, and Modelling process. In EDA sections you will learn how to import data sets and create data frames from it. Then it will help you to visualize the variables using different plots. It will give you an initial structure of your data points. In Data pre-processing sections you will get the full idea of Missing value & outliers treatment and data split methods. Finally, you will be able to generate machine learning models using Linear and Logistic Regression.

This R programming for data science and data analytics is designed for both complete beginners with no programming experience or experienced developers looking to make the jump to Data Science!

A. C. Faul ... 334 pages - Language: English - Publisher: Chapman and Hall/CRC; (August, 2019) - AmazonSIN: ‎B07VYV4NLM.


The emphasis of the book is on the question of Why – only if why an algorithm is successful is understood, can it be properly applied, and the results trusted. Algorithms are often taught side by side without showing the similarities and differences between them. This book addresses the commonalities, and aims to give a thorough and in-depth treatment and develop intuition, while remaining concise. This useful reference should be an essential on the bookshelves of anyone employing machine learning techniques.

Jonathan Schwabish ... 384 pages - Language: English - Publisher: A.K. Peters/CRC Press; (May, 2023) - ISBN-10: ‎1032343265 - ISBN-13: ‎978-1032343266.

This book closes the gap between what people think Excel can do and what they can achieve in the tool. Over the past few years, recognition of the importance of effectively visualizing data has led to an explosion of data analysis and visualization software tools. But for many people, Microsoft Excel continues to be the workhorse for their data visualization needs, not to mention the only tool that many data workers have access to. Although Excel is not a specialist data visualization platform, it does have strong capabilities. The default chart types do not need to be the limit of the tool’s data visualization capabilities, and users can extend its features by understanding some key elements and strategies.

Data Visualization in Excel provides a step-by-step guide to creating more advanced and often more effective data visualizations in Excel and is the perfect guide for anyone who wants to create better, more effective, and more engaging data visualizations.

Lars Grüne,‎ Jürgen Pannek ... 456 pages - Publisher: Springer; 2nd edition (November 11, 2016) - Language: English - ISBN-10: 3319460234 - ISBN-13: 978-3319460239.

This book offers readers a thorough and rigorous introduction to nonlinear model predictive control (NMPC) for discrete-time and sampled-data systems. NMPC schemes with and without stabilizing terminal constraints are detailed, and intuitive examples illustrate the performance of different NMPC variants. NMPC is interpreted as an approximation of infinite-horizon optimal control so that important properties like closed-loop stability, inverse optimality and suboptimality can be derived in a uniform manner. These results are complemented by discussions of feasibility and robustness. An introduction to nonlinear optimal control algorithms yields essential insights into how the nonlinear optimization routine―the core of any nonlinear model predictive controller―works. Accompanying software in MATLAB® and C++ (downloadable from extras.springer.com/), together with an explanatory appendix in the book itself, enables readers to perform computer experiments exploring the possibilities and limitations of NMPC. The second edition has been substantially rewritten, edited and updated to reflect the significant advances that have been made since the publication of its predecessor, including: • a new chapter on economic NMPC relaxing the assumption that the running cost penalizes the distance to a pre-defined equilibrium; • a new chapter on distributed NMPC discussing methods which facilitate the control of large-scale systems by splitting up the optimization into smaller subproblems; • an extended discussion of stability and performance using approximate updates rather than full optimization; • replacement of the pivotal sufficient condition for stability without stabilizing terminal conditions with a weaker alternative and inclusion of an alternative and much simpler proof in the analysis; and • further variations and extensions in response to suggestions from readers of the first edition. Though primarily aimed at academic researchers and practitioners working in control and optimization, the text is self-contained, featuring background material on infinite-horizon optimal control and Lyapunov stability theory that also makes it accessible for graduate students in control engineering and applied mathematics.

Mircea Ancau ... 295 pages - Publisher: Cambridge Scholars Publishing; (November, 2019) ... Language: English - ISBN-10: 1527538494 - ISBN-13: 978-1527538498.

A comprehensive introduction to optimization with a focus on practical algorithms for the design of engineering systems: This book offers a comprehensive introduction to optimization with a focus on practical algorithms. The book approaches optimization from an engineering perspective, where the objective is to design a system that optimizes a set of metrics subject to constraints. Readers will learn about computational approaches for a range of challenges, including searching high-dimensional spaces, handling problems where there are multiple competing objectives, and accommodating uncertainty in the metrics. Figures, examples, and exercises convey the intuition behind the mathematical approaches. The text provides concrete implementations in the Julia programming language.

Wenyu Sun, Ya-Xiang Yuan ... 688 pages - Publisher: Springer; (May, 2006) ... Language: English - ISBN-10: 0387249753 - ISBN-13: 978-0387249759.

This book, a result of the author's teaching and research experience in various universities and institutes over the past ten years, can be used as a textbook for an optimization course for graduates and senior undergraduates. It systematically describes optimization theory and several powerful methods, including recent results. For most methods, the authors discuss an idea’s motivation, study the derivation, establish the global and local convergence, describe algorithmic steps, and discuss the numerical performance. The book deals with both theory and algorithms of optimization concurrently. It also contains an extensive bibliography. Finally, apart from its use for teaching, Optimization Theory and Methods will be very beneficial as a research reference.

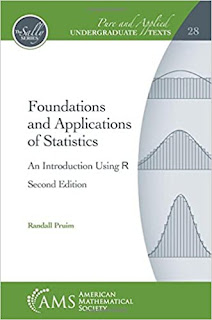
Randall Pruim ... 820 pages - Publisher: American Mathematical Society; 2nd Edition (April, 2018) - Language: English - ISBN-10: ‎1470428482 - ISBN-13: 978-1470428488.

Foundations and Applications of Statistics simultaneously emphasizes both the foundational and the computational aspects of modern statistics. Engaging and accessible, this book is useful to undergraduate students with a wide range of backgrounds and career goals. The exposition immediately begins with statistics, presenting concepts and results from probability along the way. Hypothesis testing is introduced very early, and the motivation for several probability distributions comes from p-value computations. Pruim develops the students' practical statistical reasoning through explicit examples and through numerical and graphical summaries of data that allow intuitive inferences before introducing the formal machinery. The topics have been selected to reflect the current practice in statistics, where computation is an indispensible tool. In this vein, the statistical computing environment $\textsf{R}$ is used throughout the text and is integral to the exposition. Attention is paid to developing students' mathematical and computational skills as well as their statistical reasoning. Linear models, such as regression and ANOVA, are treated with explicit reference to the underlying linear algebra, which is motivated geometrically. Foundations and Applications of Statistics discusses both the mathematical theory underlying statistics and practical applications that make it a powerful tool across disciplines. The book contains ample material for a two-semester course in undergraduate probability and statistics. A one-semester course based on the book will cover hypothesis testing and confidence intervals for the most common situations.

Subal C. Kumbhakar, Hung-Jen Wang, Alan P. Horncastle ... 374 pages - Language: ‎ English - Publisher: ‎ Cambridge Univ. Press; (January, 2015) - ISBN-10: ‎ 1107609461 - ISBN-13: 978-1107609464.


Stochastic Frontier Analysis Using Stata provides practitioners in academia and industry with a step-by-step guide on how to conduct efficiency analysis using the stochastic frontier approach. The authors explain in detail how to estimate production, cost, and profit efficiency and introduce the basic theory of each model in an accessible way, using empirical examples that demonstrate the interpretation and application of models. This book also provides computer code, allowing users to apply the models in their own work, and incorporates the most recent stochastic frontier models developed in academic literature. Such recent developments include models of heteroscedasticity and exogenous determinants of inefficiency, scaling models, panel models with time-varying inefficiency, growth models, and panel models that separate firm effects and persistent and transient inefficiency. Immensely helpful to applied researchers, this book bridges the chasm between theory and practice, expanding the range of applications in which production frontier analysis may be implemented.

MathWorks MATLAB 2022a v9.12.0.1884302  [Size: 20.8 GB] ... MATLAB is a highlevel language and interactive environment that is used by millions of engineers and scientists around the world. It allows you to explore and visualize ideas and collaborate in various disciplines, including signal and image processing, communications, management systems and financial engineering. Whether you’re analyzing data, developing algorithms, or creating models, MATLAB is designed for the way you think and the work you do. MATLAB toolboxes are professionally developed, rigorously tested, and fully documented. MATLAB apps let you see how different algorithms work with your data. Iterate until you’ve got the results you want, then automatically generate a MATLAB program to reproduce or automate your work. Scale your analyses to run on clusters, GPUs, and clouds with only minor code changes. There’s no need to rewrite your code or learn big data programming and out-of-memory techniques. 

Features of Mathworks Matlab: Perform a variety of complex mathematical calculations and heavy + Development environment for managing code, files, and data + Explore ways to achieve this solution + A variety of mathematical functions for linear algebra, statistics, Fourier analysis, optimization, filtering, numerical integration and ... + Drawing two-dimensional and three-dimensional graphics functions for visualizing data as + Design and construction of user interfaces under the programming languages ​​C ++, C or Java + Ability to test and measure the exact functions and graphs + The possibility of communication signal processing, image and video + There are various Jbhabzarhay engineering companies for specific applications such as + Telecommunications, control, fuzzy, estimates, statistics, data collection, simulation systems.

Tonny J. Oyana ... 354 pages - Language: ‎English - Publisher: CRC Press; 2nd edition (September, 2020) - ISBN-10: 0367860856 - ISBN-13:‎ 978-0367860851.


In the five years since the publication of the first edition of Spatial Analysis: Statistics, Visualization, and Computational Methods, many new developments have taken shape regarding the implementation of new tools and methods for spatial analysis with R. The use and growth of artificial intelligence, machine learning and deep learning algorithms with a spatial perspective, and the interdisciplinary use of spatial analysis are all covered in this second edition along with traditional statistical methods and algorithms to provide a concept-based problem-solving learning approach to mastering practical spatial analysis. Spatial Analysis with R: Statistics, Visualization, and Computational Methods, Second Edition provides a balance between concepts and practicums of spatial statistics with a comprehensive coverage of the most important approaches to understand spatial data, analyze spatial relationships and patterns, and predict spatial processes.

New in the Second Edition: Includes new practical exercises and worked-out examples using R + Presents a wide range of hands-on spatial analysis worktables and lab exercises + All chapters are revised and include new illustrations of different concepts using data from environmental and social sciences + Expanded material on spatiotemporal methods, visual analytics methods, data science, and computational methods + Explains big data, data management, and data mining

Frederick J. Gravetter, Larry B. Wallnau, Lori-Ann B. Forzano, James E. Witnauer ... 608 pages - Language: English - Publisher:‎ Cengage Learning; 10th edition (January, 2020) - ISBN-10: 0357365291 - ISBN-13: ‎978-0357365298.


Updated with the latest research, Gravetter/Wallnau/Forzano/Witnauer's Essentials of Statistics for the Behavioral Sciences, 10th Edition delivers straightforward instruction, hands-on learning tools and real-world examples to help you go beyond memorizing formulas to truly understanding the hows and whys of statistics. Giving extra focus to the topics students typically struggle with most, the authors take time to fully explain statistical concepts. Integrated applications reinforce concepts, offering further support to ensure that even those with a weak background in mathematics can fully grasp statistics. The authors also illustrate how an understanding of statistical procedures will help you comprehend published findings -- ultimately leading you to become a savvy consumer of information. Also available, the MindTap digital learning solution helps you learn on your own terms.

Contact Form

Name

Email *

Message *

Powered by Blogger.