Articles by "Regression Analysis"

Showing posts with label Regression Analysis. Show all posts

Peter J. Brockwell, Richard A. Davis ... 439 pages - Publisher: Springer; 3rd edition (August, 2016) - Language: English.

This book is aimed at the reader who wishes to gain a working knowledge of time series and forecasting methods as applied to economics, engineering and the natural and social sciences. It assumes knowledge only of basic calculus, matrix algebra and elementary statistics. This third edition contains detailed instructions for the use of the professional version of the Windows-based computer package ITSM2000, now available as a free download from the Springer Extras website. The logic and tools of time series model-building are developed in detail. Numerous exercises are included and the software can be used to analyze and forecast data sets of the user's own choosing. The book can also be used in conjunction with other time series packages such as those included in R. The programs in ITSM2000 however are menu-driven and can be used with minimal investment of time in the computational details.

The core of the book covers stationary processes, ARMA and ARIMA processes, multivariate time series and state-space models, with an optional chapter on spectral analysis. Many additional special topics are also covered. New to this edition: A chapter devoted to Financial Time Series - Introductions to Brownian motion, Lévy processes and Itô calculus - An expanded section on continuous-time ARMA processes.

Steven W. Knox ... Language: English - AmazonSIN: B07BHYKL4V ... 516 pages - Publisher: Wiley; (March, 2018).


Machine Learning: a Concise Introduction offers a comprehensive introduction to the core concepts, approaches, and applications of machine learning. The author—an expert in the field—presents fundamental ideas, terminology, and techniques for solving applied problems in classification, regression, clustering, density estimation, and dimension reduction. The design principles behind the techniques are emphasized, including the bias-variance trade-off and its influence on the design of ensemble methods. Understanding these principles leads to more flexible and successful applications. Machine Learning: a Concise Introduction also includes methods for optimization, risk estimation, and model selection— essential elements of most applied projects. 

This important resource: Illustrates many classification methods with a single, running example, highlighting similarities and differences between methods + Presents R source code which shows how to apply and interpret many of the techniques covered + Includes many thoughtful exercises as an integral part of the text, with an appendix of selected solutions + Contains useful information for effectively communicating with clients.

Richard J. Brook, Gregory C. Arnold ... 256 pages - ISBN-10: 0824772520 - ISBN-13: 978-0824772529 ... Publisher : CRC Press; (December, 2018) - Language: English.


For a solid foundation of important statistical methods, the concise, single-source text unites linear regression with analysis of experiments and provides students with the practical understanding needed to apply theory in real data analysis problems.Stressing principles while keeping computational and theoretical details at a manageable level, Applied Regression Analysis and Experimental Design features an emphasis on vector geometry and least squares to unify and provide an intuitive basis for most topics covered… abundant examples and exercises using real-life data sets clearly illustrating practical of data analysis…essential exposure to MINITAB and GENSTAT computer packages , including computer printouts…and important background material such as vector and matrix properties and the distributional properties of quadratic forms.Designed to make theory work for students, this clearly written, easy-to-understand work serves as the ideal texts for courses Regression, Experimental Design, and Linear Models in a broad range of disciplines. Moreover, applied statisticians will find the book a useful reference for the general application of the linear model.

Edward W. (Jed) Frees ... 584 pages - ISBN-10: 0521135966 - ISBN-13: 978-0521135962 .... Publisher: Cambridge Univ. Press; (February, 2010) - Language: English.


Statistical techniques can be used to address new situations. This is important in a rapidly evolving risk management and financial world. Analysts with a strong statistical background understand that a large data set can represent a treasure trove of information to be mined and can yield a strong competitive advantage. This book provides budding actuaries and financial analysts with a foundation in multiple regression and time series. Readers will learn about these statistical techniques using data on the demand for insurance, lottery sales, foreign exchange rates, and other applications. Although no specific knowledge of risk management or finance is presumed, the approach introduces applications in which statistical techniques can be used to analyze real data of interest. In addition to the fundamentals, this book describes several advanced statistical topics that are particularly relevant to actuarial and financial practice, including the analysis of longitudinal, two-part (frequency/severity), and fat-tailed data. Datasets with detailed descriptions, sample statistical software scripts in "R" and "SAS," and tips on writing a statistical report, including sample projects, can be found on the book's Web site: http://research.bus.wisc.edu/RegActuaries.

John Fox ... 816 pages - Publisher: SAGE Publications; 3rd edition (April, 2015) ... Language: English - ISBN-10: 1452205663 - ISBN-13: 978-1452205663.

Combining a modern, data-analytic perspective with a focus on applications in the social sciences, the Third Edition of Applied Regression Analysis and Generalized Linear Models provides in-depth coverage of regression analysis, generalized linear models, and closely related methods, such as bootstrapping and missing data. Updated throughout, this Third Edition includes new chapters on mixed-effects models for hierarchical and longitudinal data. Although the text is largely accessible to readers with a modest background in statistics and mathematics, author John Fox also presents more advanced material in optional sections and chapters throughout the book.

Galit Shmueli, Peter C. Bruce, Nitin R. Patel ... 560 pages - Publisher: Wiley; 3rd edition (April, 2016) ... Language: English - ISBN-10: 1118729277 - ISBN-13: 978-1118729274.

Data Mining for Business Analytics: Concepts, Techniques, and Applications in XLMiner®, Third Edition presents an applied approach to data mining and predictive analytics with clear exposition, hands-on exercises, and real-life case studies. Readers will work with all of the standard data mining methods using the Microsoft® Office Excel® add-in XLMiner® to develop predictive models and learn how to obtain business value from Big Data. Featuring updated topical coverage on text mining, social network analysis, collaborative filtering, ensemble methods, uplift modeling and more, the Third Edition also includes: Real-world examples to build a theoretical and practical understanding of key data mining methods + End-of-chapter exercises that help readers better understand the presented material + Data-rich case studies to illustrate various applications of data mining techniques + Completely new chapters on social network analysis and text mining + A companion site with additional data sets, instructors material that include solutions to exercises and case studies, and Microsoft PowerPoint® slides https://www.dataminingbook.com + Free 140-day license to use XLMiner for Education software.

Data Mining for Business Analytics: Concepts, Techniques, and Applications in XLMiner®, Third Edition is an ideal textbook for upper-undergraduate and graduate-level courses as well as professional programs on data mining, predictive modeling, and Big Data analytics. The new edition is also a unique reference for analysts, researchers, and practitioners working with predictive analytics in the fields of business, finance, marketing, computer science, and information technology.

Iain Pardoe .. 346 pages - Publisher: Wiley; 2nd edition (July, 2012) ... Language: English - ISBN-10: 1118097289 - ISBN-13: 978-1118097281.

Fully revised to reflect the latest methodologies and emerging applications, Applied Regression Modeling, Second Edition continues to highlight the benefits of statistical methods, specifically regression analysis and modeling, for understanding, analyzing, and interpreting multivariate data in business, science, and social science applications. The author utilizes a bounty of real-life examples, case studies, illustrations, and graphics to introduce readers to the world of regression analysis using various software packages, including R, SPSS, Minitab, SAS, JMP, and S-PLUS. In a clear and careful writing style, the book introduces modeling extensions that illustrate more advanced regression techniques, including logistic regression, Poisson regression, discrete choice models, multilevel models, and Bayesian modeling.

In addition, the Second Edition features clarification and expansion of challenging topics, such as: Transformations, indicator variables, and interaction + Testing model assumptions + Nonconstant variance + Autocorrelation + Variable selection methods + Model building and graphical interpretation. Throughout the book, datasets and examples have been updated and additional problems are included at the end of each chapter, allowing readers to test their comprehension of the presented material. In addition, a related website features the book's datasets, presentation slides, detailed statistical software instructions, and learning resources including additional problems and instructional videos.

Roger Koenker, Victor Chernozhukov, Xuming He, Limin Peng ... 483 pages - Publisher: Chapman and Hall/CRC; (October, 2017) ... Language: English - AmazonSIN: B076DG4VR4.

Quantile regression constitutes an ensemble of statistical techniques intended to estimate and draw inferences about conditional quantile functions. Median regression, as introduced in the 18th century by Boscovich and Laplace, is a special case. In contrast to conventional mean regression that minimizes sums of squared residuals, median regression minimizes sums of absolute residuals; quantile regression simply replaces symmetric absolute loss by asymmetric linear loss. Since its introduction in the 1970's by Koenker and Bassett, quantile regression has been gradually extended to a wide variety of data analytic settings including time series, survival analysis, and longitudinal data. By focusing attention on local slices of the conditional distribution of response variables it is capable of providing a more complete, more nuanced view of heterogeneous covariate effects. Applications of quantile regression can now be found throughout the sciences, including astrophysics, chemistry, ecology, economics, finance, genomics, medicine, and meteorology. Software for quantile regression is now widely available in all the major statistical computing environments.

The objective of this volume is to provide a comprehensive review of recent developments of quantile regression methodology illustrating its applicability in a wide range of scientific settings. The intended audience of the volume is researchers and graduate students across a diverse set of disciplines.

Sanford Weisberg ... 368 pages - Publisher: Wiley; 4th edition (December, 2013) ... Language: English - ISBN-10: 9781118386088 - ISBN-13: 978-1118386088.

The Fourth Edition of Applied Linear Regression provides a thorough update of the basic theory and methodology of linear regression modeling. Demonstrating the practical applications of linear regression analysis techniques, the Fourth Edition uses interesting, real-world exercises and examples. Stressing central concepts such as model building, understanding parameters, assessing fit and reliability, and drawing conclusions, the new edition illustrates how to develop estimation, confidence, and testing procedures primarily through the use of least squares regression. 

While maintaining the accessible appeal of each previous edition, Applied Linear Regression, Fourth Edition features: Graphical methods stressed in the initial exploratory phase, analysis phase, and summarization phase of an analysis + In-depth coverage of parameter estimates in both simple and complex models, transformations, and regression diagnostics + Newly added material on topics including testing, ANOVA, and variance assumptions + Updated methodology, such as bootstrapping, cross-validation binomial and Poisson regression, and modern model selection methods. Applied Linear Regression, Fourth Edition is an excellent textbook for upper-undergraduate and graduate-level students, as well as an appropriate reference guide for practitioners and applied statisticians in engineering, business administration, economics, and the social sciences.

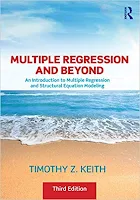
Timothy Z. Keith ... 654 pages - Publisher: Routledge; 3rd edition (January, 2019) ... Language: English - ISBN-10: 1138061441 - ISBN-13: 978-1138061446.

Multiple Regression and Beyond offers a conceptually-oriented introduction to multiple regression (MR) analysis and structural equation modeling (SEM), along with analyses that flow naturally from those methods. By focusing on the concepts and purposes of MR and related methods, rather than the derivation and calculation of formulae, this book introduces material to students more clearly, and in a less threatening way. In addition to illuminating content necessary for coursework, the accessibility of this approach means students are more likely to be able to conduct research using MR or SEM--and more likely to use the methods wisely. This book: • Covers both MR and SEM, while explaining their relevance to one another • Includes path analysis, confirmatory factor analysis, and latent growth modeling • Makes extensive use of real-world research examples in the chapters and in the end-of-chapter exercises • Extensive use of figures and tables providing examples and illustrating key concepts and techniques.

Soumya D. Mohanty ... 136 pages - Publisher: Chapman and Hall/CRC; (December, 2018) ... Language: English - ASIN: B07LCWSVMD by Amazon.

A core task in statistical analysis, especially in the era of Big Data, is the fitting of flexible, high-dimensional, and non-linear models to noisy data in order to capture meaningful patterns. This can often result in challenging non-linear and non-convex global optimization problems. The large data volume that must be handled in Big Data applications further increases the difficulty of these problems. Swarm Intelligence Methods for Statistical Regression describes methods from the field of computational swarm intelligence (SI), and how they can be used to overcome the optimization bottleneck encountered in statistical analysis.

Features: Provides a short, self-contained overview of statistical data analysis and key results in stochastic optimization theory + Focuses on methodology and results rather than formal proofs + Reviews SI methods with a deeper focus on Particle Swarm Optimization (PSO) + Uses concrete and realistic data analysis examples to guide the reader + Includes practical tips and tricks for tuning PSO to extract good performance in real world data analysis challenges.

Charles M. Judd, Gary H. McClelland, Carey S. Ryan ... 378 pages - Publisher: Routledge; 3rd edition (May, 2017) ... Language: English - ISBN-10: 1138819832 - ISBN-13: 978-1138819832.

Data Analysis: A Model Comparison Approach to Regression, ANOVA, and Beyond is an integrated treatment of data analysis for the social and behavioral sciences. It covers all of the statistical models normally used in such analyses, such as multiple regression and analysis of variance, but it does so in an integrated manner that relies on the comparison of models of data estimated under the rubric of the general linear model. Data Analysis also describes how the model comparison approach and uniform framework can be applied to models that include product predictors (i.e., interactions and nonlinear effects) and to observations that are nonindependent. Indeed, the analysis of nonindependent observations is treated in some detail, including models of nonindependent data with continuously varying predictors as well as standard repeated measures analysis of variance. This approach also provides an integrated introduction to multilevel or hierarchical linear models and logistic regression. Finally, Data Analysis provides guidance for the treatment of outliers and other problematic aspects of data analysis. It is intended for advanced undergraduate and graduate level courses in data analysis and offers an integrated approach that is very accessible and easy to teach.

Highlights of the third edition include: A new chapter on logistic regression; Expanded treatment of mixed models for data with multiple random factors; Updated examples; An enhanced website with PowerPoint presentations and other tools that demonstrate the concepts in the book; exercises for each chapter that highlight research findings from the literature; data sets, R code, and SAS output for all analyses; additional examples and problem sets; and test questions.

Erik Cuevas, Daniel Zaldívar, Marco Pérez-Cisneros ... 218 pages - Publisher: Springer; (April, 2018) ... Language: English - ASIN: B07C3LK4K3 by Amazon.

This book explores new alternative metaheuristic developments that have proved to be effective in their application to several complex problems. Though most of the new metaheuristic algorithms considered offer promising results, they are nevertheless still in their infancy. To grow and attain their full potential, new metaheuristic methods must be applied in a great variety of problems and contexts, so that they not only perform well in their reported sets of optimization problems, but also in new complex formulations. The only way to accomplish this is to disseminate these methods in various technical areas as optimization tools. In general, once a scientist, engineer or practitioner recognizes a problem as a particular instance of a more generic class, he/she can select one of several metaheuristic algorithms that guarantee an expected optimization performance. Unfortunately, the set of options are concentrated on algorithms whose popularity and high proliferation outstrip those of the new developments. This structure is important, because the authors recognize this methodology as the best way to help researchers, lecturers, engineers and practitioners solve their own optimization problems.

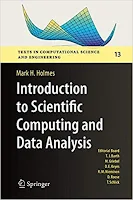
Mark H. Holmes ... 497 pages - Publisher: Springer; (May, 2016) ... Language: English - ISBN-10: 331930254X - ISBN-13: 978-3319302546

This textbook provides and introduction to numerical computing and its applications in science and engineering. The topics covered include those usually found in an introductory course, as well as those that arise in data analysis. This includes optimization and regression based methods using a singular value decomposition. The emphasis is on problem solving, and there are numerous exercises throughout the text concerning applications in engineering and science. The essential role of the mathematical theory underlying the methods is also considered, both for understanding how the method works, as well as how the error in the computation depends on the method being used. The MATLAB codes used to produce most of the figures and data tables in the text are available on the author’s website and SpringerLink.

Christian Ritz, Signe Marie Jensen, Daniel Gerhard, Jens Carl Streibig ... 226 pages - Publisher: Chapman and Hall/CRC; (July, 2019) ... Language: English - ISBN-10: 1138034312 - ISBN-13: 978-1138034310

Nowadays the term dose-response is used in many different contexts and many different scientific disciplines including agriculture, biochemistry, chemistry, environmental sciences, genetics, pharmacology, plant sciences, toxicology, and zoology. In the 1940 and 1950s, dose-response analysis was intimately linked to evaluation of toxicity in terms of binary responses, such as immobility and mortality, with a limited number of doses of a toxic compound being compared to a control group (dose 0). Later, dose-response analysis has been extended to other types of data and to more complex experimental designs. Moreover, estimation of model parameters has undergone a dramatic change, from struggling with cumbersome manual operations and transformations with pen and paper to rapid calculations on any laptop. Advances in statistical software have fueled this development.

Key Features: Provides a practical and comprehensive overview of dose-response analysis. + Includes numerous real data examples to illustrate the methodology. + R code is integrated into the text to give guidance on applying the methods. + Written with minimal mathematics to be suitable for practitioners. + Includes code and datasets on the book’s GitHub: https://github.com/DoseResponse. This book focuses on estimation and interpretation of entirely parametric nonlinear dose-response models using the powerful statistical environment R. Specifically, this book introduces dose-response analysis of continuous, binomial, count, multinomial, and event-time dose-response data. The statistical models used are partly special cases, partly extensions of nonlinear regression models, generalized linear and nonlinear regression models, and nonlinear mixed-effects models (for hierarchical dose-response data). Both simple and complex dose-response experiments will be analyzed.

Samprit Chatterjee, Jeffrey S. Simonoff ... 252 pages - Publisher: Wiley; (December, 2012) ... Language: English - ISBN-10: 0470887168 - ISBN-13: 978-0470887165

Written by two established experts in the field, the purpose of the Handbook of Regression Analysis is to provide a practical, one-stop reference on regression analysis. The focus is on the tools that both practitioners and researchers use in real life. It is intended to be a comprehensive collection of the theory, methods, and applications of regression methods, but it has been deliberately written at an accessible level. The handbook provides a quick and convenient reference or “refresher” on ideas and methods that are useful for the effective analysis of data and its resulting interpretations. Students can use the book as an introduction to and/or summary of key concepts in regression and related course work (including linear, binary logistic, multinomial logistic, count, and nonlinear regression models). Theory underlying the methodology is presented when it advances conceptual understanding and is always supplemented by hands-on examples.

Daniel J. Denis ... 224 pages - Publisher: Wiley; (September, 2018) ... Language: English - ISBN-10: 9781119465812 - ISBN-13: 978-1119465812

This concise and very easy-to-use primer introduces readers to a host of computational tools useful for making sense out of data, whether that data come from the social, behavioral, or natural sciences. The book places great emphasis on both data analysis and drawing conclusions from empirical observations. It also provides formulas where needed in many places, while always remaining focused on concepts rather than mathematical abstraction. SPSS Data Analysis for Univariate, Bivariate, and Multivariate Statistics offers a variety of popular statistical analyses and data management tasks using SPSS that readers can immediately apply as needed for their own research, and emphasizes many helpful computational tools used in the discovery of empirical patterns. The book begins with a review of essential statistical principles before introducing readers to SPSS. The book then goes on to offer chapters on: Exploratory Data Analysis, Basic Statistics, and Visual Displays; Data Management in SPSS; Inferential Tests on Correlations, Counts, and Means; Power Analysis and Estimating Sample Size; Analysis of Variance – Fixed and Random Effects; Repeated Measures ANOVA; Simple and Multiple Linear Regression; Logistic Regression; Multivariate Analysis of Variance (MANOVA) and Discriminant Analysis; Principal Components Analysis; Exploratory Factor Analysis; and Non-Parametric Tests. This helpful resource allows readers to: Understand data analysis in practice rather than delving too deeply into abstract mathematical concepts. Make use of computational tools used by data analysis professionals. Focus on real-world application to apply concepts from the book to actual research.

Conrad Carlberg ... 568 pages - Publisher: Que Publishing; (December, 2017) ... Language: English - ISBN-10: 0789759055 - ISBN-13: 978-0789759054

Nationally recognized Excel expert Conrad Carlberg shows you how to use Excel 2016 to perform core statistical tasks every business professional, student, and researcher should master. Using real-world examples and downloadable workbooks, Carlberg helps you choose the right technique for each problem and get the most out of Excel’s statistical features. Along the way, he clarifies confusing statistical terminology and helps you avoid common mistakes. You’ll learn how to use correlation and regression, analyze variance and covariance, and test statistical hypotheses using the normal, binomial, t, and F distributions. To help you make accurate inferences based on samples from a population, Carlberg offers insightful coverage of crucial topics ranging from experimental design to the statistical power of F tests. Updated for Excel 2016, this guide covers both modern consistency functions and legacy compatibility functions. Becoming an expert with Excel statistics has never been easier! In this book, you’ll find crystal-clear instructions, insider insights, and complete step-by-step guidance.

Artificial Neural Networks: Understand The Basic Concepts [Size: 285 MB] ... Artificial Intelligence is becoming progressively more relevant in today’s world. The rise of Artificial intelligence has the potential to transform our future more than any other technology. By using the power of algorithms, you can develop applications which intelligently interact with the world around you, from building intelligent recommender systems to creating self-driving cars, robots and chatbots. Neural networks are a key element of artificial intelligence.

Neural networks are one of the most fascinating machine learning models and are used to solve wide range of problems in different areas of artificial intelligence and machine learning. Yet too few really understand how neural networks actually work. This course will take you on a fun and unhurried journey, starting from very simple ideas, and gradually building up an understanding of how neural networks work. The purpose of this course is to make neural networks accessible to as many students as possible.

In this course I’m going to explain the key aspects of neural networks and provide you with a foundation to get started with advanced topics. You will build a solid foundation knowledge of how a neural network learns from data, and the principles behind it. You will not only learn how to train neural networks, but will also explore generalization of these networks. Later we will delve into combining different neural network models and work with the real-world use cases. You’ll understand how to solve complex computational problems efficiently.

Practical Statistics For Data And Business Analysis [Size: 6.34 GB] ... This course material is prepared from highly experienced engineers worked in a leader companies like Microsoft , Facebook and Google. After hard working from five months ago we created +270 Lectures/Articles to cover everything related to practical statistics. In no time with simple and easy way you will learn and love statistics. We stress in this course to make it very spontaneous to make all students love statistics .

Contact Form

Name

Email *

Message *

Powered by Blogger.